Track Attendance Rate: Copyable Formulas and a Team Score for Organizers

Track Attendance Rate: Copyable Formulas and a Team Score for Organizers
Your attendance rate is (attended sessions ÷ possible sessions) × 100. The numerator is every session a person actually showed up for, and the denominator is every session they could have attended. Before you measure anything, do two things: define your reporting period and what counts as a session, then pick a tracking method, either a spreadsheet or software.
TL;DR:
- Define the reporting period, session unit, partial attendance credit, and rules for joiners or long term leave; report excused and unexcused absences separately.
- Use separate roster, session calendar, check in log, and summary sheets; calculate group rates from total sessions, not averaged individual percentages.
- Translate targets into an absence allowance: a 90% goal across 40 sessions permits no more than four missed sessions.
- Apply the 10% persistent and 50% severe absence thresholds only to pupil data; other groups need thresholds suited to their goals.
- Keep spreadsheets for small groups; software suits multiple locations or frequent schedule changes, and a 2025 manufacturing review reported an 18% average drop in unplanned absences.
Table of Contents
- What is the attendance rate formula, and how do you apply it?
- What should you decide before you start counting?
- How do you build an attendance tracker in Excel or Google Sheets?
- How do you build a simple reliability score for a team?
- Which software features actually improve attendance tracking?
- Which metrics belong on an attendance dashboard?
- What does the research say about managing attendance well?
- An organizer’s honest take on attendance data
- How does Jubiliq handle RSVP and attendance tracking?
- FAQ
- Sources
What is the attendance rate formula, and how do you apply it?
The calculation is the same for a classroom, a shift crew, or a volunteer group. The school absence methodology in England defines the overall absence rate as total absence sessions divided by total possible sessions, multiplied by 100. Attendance is the mirror image of that. Australian guidance for manual attendance calculations uses the same logic: 100 × (actual days attended ÷ possible school days).
Here are worked examples with illustrative numbers:
- Class example: A student attends 34 of 40 possible sessions. 34 ÷ 40 = 0.85, so the attendance rate is 85%.
- Staff example: Divide the shifts worked by the shifts scheduled, then multiply by 100 to find the attendance rate.
- Part-day example: If someone works part of a shift, decide in advance how to credit partial attendance, then include that credit in the calculation.
- Allowed absences for a target: To stay at 90% across 40 sessions, multiply 40 by 0.10. You can miss at most 4 sessions.
The last calculation is the one most managers skip. Turning a target into a number of allowed absences makes the goal concrete for everyone involved.
What should you decide before you start counting?
Most attendance disputes come from unclear rules, not bad math. Standardized definitions matter because the national reporting standards used in Australian schools stress consistent definitions and reporting periods so results can be compared reliably. Settle these points in writing first:
- Reporting period: A term or season gives a stable, comparable number but reacts slowly. A calendar month is easy to explain but varies with the number of working days. A rolling period can smooth out noise and show trends sooner, though it is harder to hand-calculate.
- What a session is: Define it as a class meeting, a half-day, a shift, or a workshop. Decide in advance how part-days count: full credit, half credit, or fractional by minutes.
- Who is included: Decide how to treat mid-term joiners (count only sessions after their start date) and people on long-term leave (usually excluded from the denominator for that period).
- Excused versus unexcused absences: Report both in total, but keep the split visible. The overall rate tells you about reliability, while the split tells you whether a problem is something you can fix.
Also resist the urge to chase one magic number. Ofsted’s guidance notes that there is no single correct attendance percentage for everyone, and recommends judging patterns against your goals and looking for barriers to participation.
How do you build an attendance tracker in Excel or Google Sheets?
A spreadsheet is enough for most small groups. Follow these steps:
- Create four sheets: a master roster (one row per person), a session calendar (one row per session with date and weight), a raw check-in log (one row per person per session), and a summary dashboard.
- Log every check-in on the raw sheet with columns for Date, Name, Status (P for present, A for absent, L for late), and Credit (1, 0, or a fraction such as 0.5).
- Count possible sessions per person on the roster. If column B holds possible sessions, a formula like
=COUNTIFS(Log!B:B, A2, Log!A:A, ">="&Summary!$B$1, Log!A:A, "<="&Summary!$B$2)counts every logged session for that person inside your start and end dates. - Count attended sessions in column C with
=SUMIFS(Log!D:D, Log!B:B, A2, Log!A:A, ">="&Summary!$B$1, Log!A:A, "<="&Summary!$B$2). Summing the Credit column handles partial attendance automatically. - Calculate the rate in column D with
=IF(B2>0, C2/B2, "n/a")and format it as a percentage. - Aggregate the cohort by dividing the sum of attended sessions by the sum of possible sessions. Do not average the individual percentages, because that gives equal weight to people with different numbers of sessions.
- Compute allowed absences with a formula that multiplies possible sessions by the share of absences allowed, then rounds down to a whole session.
- Normalize dates before importing a CSV. Convert text dates with
=DATEVALUE(A2), and keep one date format across all sheets.
Pro Tip: Protect the formula cells and never edit the raw check-in log after the fact. If you need a correction, add a new row with a note, so you always have an audit trail.
How do you build a simple reliability score for a team?
An attendance rate alone treats a late arrival the same as a perfect day. For hourly or shift teams, a weighted score gives a fairer picture. One compact version looks like this:
A reliability score can combine attendance, punctuality, and unplanned absences using weights chosen to reflect what matters in your operation.

These weights are a starting point, not a standard, so adjust them to what matters in your operation. Here is a worked example with illustrative numbers. Say an employee worked 18 of 20 scheduled shifts (0.90), arrived on time for 16 of those 18 (about 0.89), and had one unplanned absence out of 20 shifts (0.05). The score is 0.6 × 0.90 + 0.3 × 0.89 + 0.1 × 0.95 = 0.54 + 0.267 + 0.095, or roughly 0.90.
A few ways to use it well:
- Smooth it: Calculate over a rolling period so one bad week does not define someone.
- Schedule with it: Put your most dependable people on critical shifts, and pair newer staff with them.
- Coach with it: Treat a falling score as a reason for a conversation, not a verdict. A supportive check-in often reveals a fixable cause such as transport or childcare.
Which software features actually improve attendance tracking?
Move beyond spreadsheets when manual entry starts to eat your week or errors creep in. Look for these features:
- Real-time check-in by kiosk, QR code, or mobile
- Manual correction with an audit trail
- CSV export that opens cleanly in your spreadsheet
- User permissions, so managers see their team only
- A dashboard with live headcounts and trends
The evidence for dashboards is encouraging. A 2025 review of workforce analytics in manufacturing found that MIS dashboards and predictive absence analytics improved labor planning accuracy and reduced unplanned absences, with an average reduction of 18%.
Questions to ask any vendor: Can I export all my data at any time? What privacy controls exist? Does check-in work offline? Does it connect to our calendar, student system, or HR tools?
As a rule of thumb, a spreadsheet wins for one team and a handful of sessions. Software wins when you have many locations, frequent schedule changes, or people who need to check in without a manager present. Hospitality teams face this too: a guide to an event hosting workflow for restaurants shows how front-of-house checks and headcounts fit into a busy service.
Which metrics belong on an attendance dashboard?
Keep the dashboard short. The essentials:
- Overall attendance rate for the period
- Persistent absence rate: for pupil data, the share missing 10% or more of possible sessions
- Severe absence rate: for pupil data, the share missing 50% or more
- Session fill rate: attendees divided by capacity or expected headcount
The 10% and 50% thresholds come from the pupil absence methodology, which classifies pupil absence as persistent or severe at those levels. For staff and other groups, choose thresholds that fit your goals rather than assuming these pupil definitions apply.
For pupils, persistent absence means missing 10% or more of possible sessions. That is the threshold the England methodology uses. Other groups may need a different early-warning threshold.
Show trends with rolling averages and term-on-term comparisons, and split by cohort, team, or location. Set two alert levels: a mild dip triggers an operational review, while a sustained drop or a person crossing the persistent threshold triggers a conversation. For exports, send leadership a one-page summary with the rate, the trend, and the top three issues. If your attendance feeds event planning, our guide to event dashboard metrics shows how to map numbers like these to outcomes.
What does the research say about managing attendance well?
The evidence favors support over punishment:
- Return-to-work interviews work: A review by the Institute for Employment Studies found these conversations to be a low-cost tool, with 77% of managers reporting a positive impact.
- Policy needs people: The same research points to clear communication and supportive management as what makes attendance policies work.
- Definitions must be consistent: The national standards from ACARA exist because comparable numbers need shared rules.
- Analytics help planning: Dashboards and absence prediction support better rostering, though prediction needs data and brings trade-offs in rostering.
- Cross-check regularly: Compare your internal measures with an external standard and audit the raw log a few times a year.
An organizer’s honest take on attendance data
Most people over-engineer this. Pick simple counting rules, write them on one page, and share that page with everyone who touches the data. Then audit once a month instead of policing every daily entry. A monthly scan for missing check-ins and odd dates catches nearly everything. And if you need RSVPs, payments, and day-of headcounts in one place, stop stitching sheets together and use one system.
— HCRF
How does Jubiliq handle RSVP and attendance tracking?
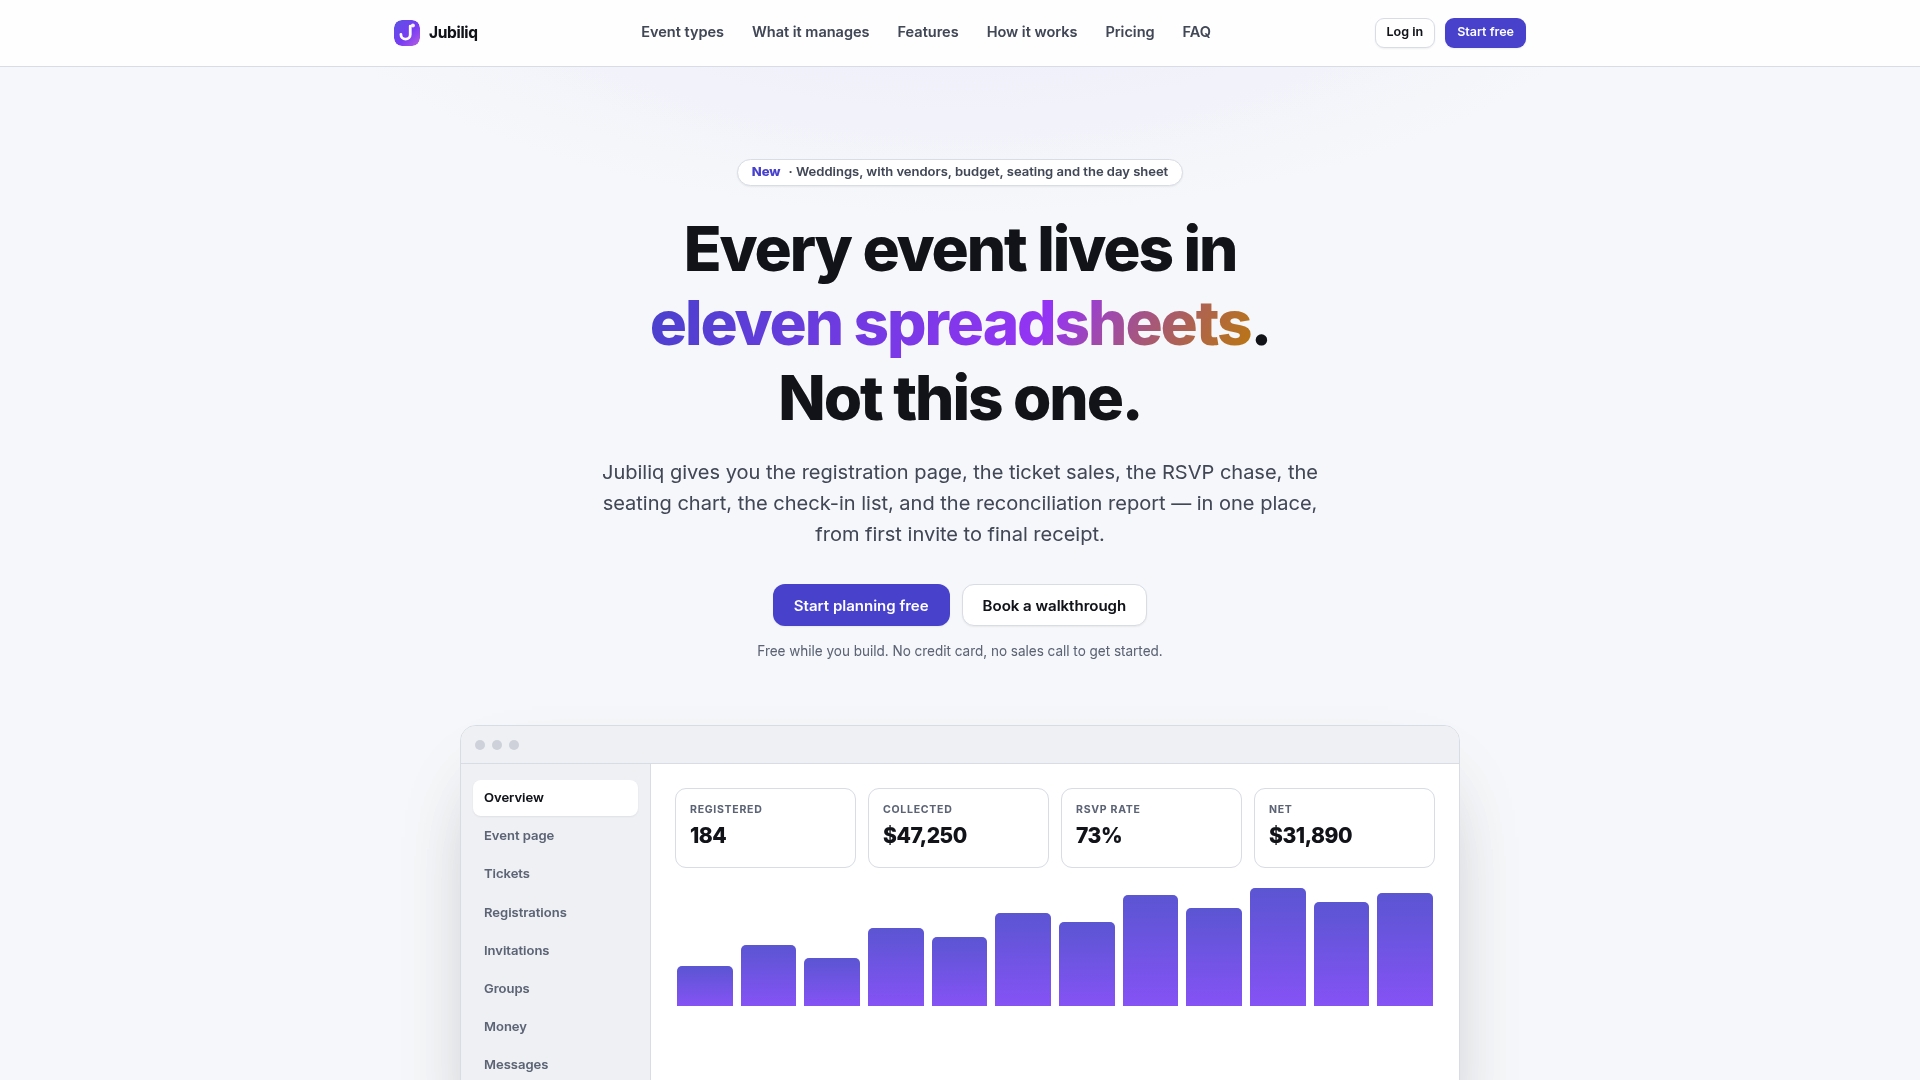
If you run events rather than classes or shifts, we built Jubiliq so the RSVP list and the day-of plan live in one place instead of three spreadsheets.
- RSVP tracking
- Real-time progress dashboards
- CSV export for your accounts or reports
- Printable day sheets for on-site coordination
It fits best when your event has RSVPs or paid tickets and you want planning and attendance in one workflow. Our RSVP tracking guide shows how that works in practice. Events without paid tickets are free on our Starter plan, and the Organizer plan charges 2% per paid registration. See the Starter, Organizer, and Enterprise options and start your next event there.
FAQ
How do I calculate my attendance percentage?
Divide the sessions you attended by the total sessions possible, then multiply by 100. The Australian school guidance uses this same approach.
What is the best attendance app for teachers?
The best choice is the one that supports quick check-in, easy corrections, and clean exports for your school’s reporting. Compare options on those features and on privacy controls rather than on brand. For a small class, a well-built spreadsheet often does the job.
What is another word for “checking attendance”?
Common alternatives are taking roll, taking the register, roll call, or recording check-ins. In a workplace you might say time and attendance tracking or shift check-in.
How many absences is 85 percent?
It depends on the total number of sessions. To calculate allowed absences, multiply total sessions by your target absence proportion.
Sources
- Pupil absence statistics: methodology: methodology - Explore education statistics - GOV.UK
- Manually calculate your school’s student attendance rates
- WORKFORCE ANALYTICS IN MANUFACTURING: A REVIEW OF MIS TOOLS FOR LABOR PLANNING, ABSENTEEISM MONITORING, AND PRODUCTIVITY OPTIMIZATION
- Improving school attendance – Ofsted: education